Conditioning
# 데이터프레임 필터링

# 필터링 조건 (Condition) 설정
condition = (df['순이익률'] > 0)

# 컨디션의 값이 True에 해당하는 부분의 데이터만 선택
df_subset = df[condition]

# '&'와 '|' 사용하여 여러개 condition 설정
condition2 = ((df['순이익률] > 0) & (df['순이익률'] < 10))

df_subset2 = df[condition2]

# 범주형(categorical) 데이터의 conditioning
df_subset3 = df[df['테마'].isin(['주류'])]

# 범주형(categorical) 데이터의 conditioning
df_subset4 = df[(df['테마'] == '주류')]
Reshaping
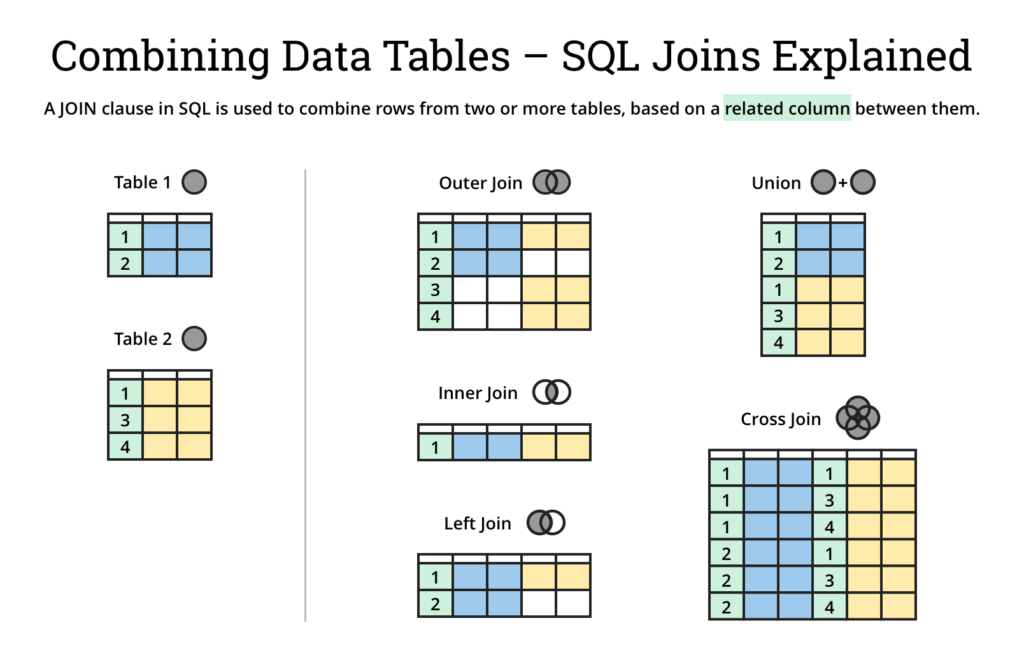
DataFrame.merge( )
- 공통된 부분을 기반으로 합치기
- 데이터베이스 스타일 조인 사용
df1 = pd.DataFrame({'a': ['foo', 'bar'], 'b': [1, 2]})
df2 = pd.DataFrame({'a': ['foo', 'baz'], 'c': [3, 4]})
df1
| a | b | |
| 0 | foo | 1 |
| 1 | bar | 2 |
df2
| a | c | |
| 0 | foo | 3 |
| 1 | baz | 4 |
# left outer join
df1.merge(df2, how='left', on='a')| a | b | c | |
| 0 | foo | 1 | 3.0 |
| 1 | bar | 2 | NaN |
# inner outer join(default)
df1.merge(df2, how='inner', on='a')| a | b | c | |
| 0 | foo | 1 | 3 |
# full outer join
df1.merge(df2, how='outer', on='a')| a | b | c | |
| 0 | foo | 1.0 | 3.0 |
| 1 | bar | 2.0 | NaN |
| 2 | baz | NaN | 4.0 |
- DataFrame.melt( )
-- wide -> tidy
cheese = pd.DataFrame({"first": ["John", "Mary"],
                       "last": ["Doe", "Bo"],
                       "height": [5.5, 6.0],
"weight": [130, 150]})| first | last | height | weight | |
| 0 | John | Doe | 5.5 | 130 |
| 1 | Mary | Bo | 6.0 | 150 |
-- 1. id_vars("first", "last")의 전체 세트를
value_vars("height", "weight")의 개수만큼 row로 쌓는다.
-- 2. var_name("quantity")(default는 "variable")에 해당하는 column에
value_vars("height", "weight")를 하나씩 채워넣는다.
-- 3. 마지막 column(default는 "value")에 해당하는 값들을 채워넣는다.
-- 4. 결과적으로 id_vars(John Doe또는 Mary Bo)의 (height 또는 weight)에 해당하는 value를 보여주는
tidy한 observation 완성
cheese.melt(id_vars=["first", "last"], var_name="quantity")| first | last | quantity | value | |
| 0 | John | Doe | height | 5.5 |
| 1 | Mary | Bo | height | 6.0 |
| 2 | John | Doe | weight | 130.0 |
| 3 | Mary | Bo | weight | 150.0 |
- pivot_table()
-- tidy -> wide
df = pd.DataFrame({"A": ["one", "one", "two", "three"] * 6,
                   "B": ["A", "B", "C"] * 8,
                   "C": ["foo", "foo", "foo", "bar", "bar", "bar"] * 4,
                   "D": np.random.randn(24),
                   "E": np.random.randn(24),
                   "F": [datetime.datetime(2013, i, 1) for i in range(1, 13)]
+ [datetime.datetime(2013, i, 15) for i in range(1, 13)]})| A | B | C | D | E | F | |
| 0 | one | A | foo | ...... | ...... | 2013-01-01 |
| 1 | one | B | foo | ...... | ...... | 2013-02-01 |
| 2 | two | C | foo | ...... | ...... | 2013-03-01 |
| 3 | three | A | bar | ...... | ...... | 2013-04-01 |
| 4 | one | B | bar | ...... | ...... | 2013-05-01 |
| ...... | ...... | ...... | ...... | ...... | ...... | ...... |
-- 1. index("A", "B") 각각에 속한 unique한 value들이
새로운 테이블의 index가 된다.
-- 2. columns("C") 각각에 속한 unique한 value들이
새로운 테이블의 colum name가 된다.
-- 3. Values("D") 각각에 속한 value들이 새로운 테이블의 value로 채워진다.
pd.pivot_table(df, values="D", index=["A", "B"], columns=["C"])| C | bar | foo | |
| A | B | ||
| one | A | ...... | ...... |
| B | ...... | ...... | |
| C | ...... | ...... | |
| three | A | ...... | NaN |
| B | NaN | ...... | |
| C | ...... | NaN | |
| two | A | NaN | ...... |
| B | ...... | NaN | |
| C | NaN | ...... |